HW 4: Spectrum Visualizer
PAT 204/504: Creative Coding (Fall 2025)
Due at 11:59pm ET on October 6
Instructions
- Please submit both your code and your final rendering. You will receive zero credit if the code is missing.
- All assignments must be completed on your own. You are welcome to exchange ideas with your peers, but this should be in the form of concepts and discussion, not in the form of writing and code.
- Provide proper citations/references for any external resources you use in your writing and code.
- Submit your work to Gradescope.
- Late submissions will be accepted for up to a week with 1 point deducted per day.
Q1: Spectrum Visualizer (5 points)
In this assignment, we are going to build a spectrum visualizer using the Sound library. The provide template sketch is the example code provided on the official Processing reference page for the FFT analyzer. This processing sketch will take your microphone inputs and apply the fast Fourier transform (FFT) algorithm to analyze the spectrum of the recorded audio. This is what it looks like when you say something into your microphone (animation):

And this is what it looks like when you sing something:

These two figures visualize the power (y-axis) of different frequency components (x-axis) of the signals. Note that the corresponding frequency range of the x-axis depends on the sampling rate of your microphone. Specifically, the frequency at each bin is \(f = SR × \frac{b}{2N}\), where \(SR\) is the sampling rate, \(b\) the bin index, and \(N\) the number of bands. For example, the above two figures are produced with a microphone at 48 kHz sampling rate, and thus the rightmost frequency bin corresponds to \(48000 × 1024/2048 = 24000\) Hz. The talking voice signal has a peak at around 5700 Hz, while the singing voice signal has a peak at around 750–800 Hz (likely a G note). Moreover, you can clearly see the difference between the spectra of the talking and singing voice signals, where the singing voice signal shows a clear harmonic structure (i.e., evenly-spaced peaks) in its spectrum, while the talking voice signal has a less-structured spectrum.
Now, your task is to build upon the example sketch and implement two additional features to make it look more like a typical spectrum visualizer we see in an audio software:
- Show only the first \(N\) out of 1024 FFT bands (depending on the sampling rate of your microphone, you may choose from \(N = 512, 256, 128\), whichever gives you the most reasonable range)
- Implement a trace that shows the previous activations which falls down gradually over time

Please submit your code as a PDE file and the final rendering as an animated GIF file.
Template Sketch
Here is a template sketch for you to get started with:
/*
  Copied from https://processing.org/reference/libraries/sound/FFT.html
*/

import processing.sound.*;

FFT fft;
AudioIn in;
int bands = 1024;
float[] spectrum = new float[bands];

void setup() {
  size(1024, 360);
  background(255);

  // Create an Input stream which is routed into the Amplitude analyzer
  fft = new FFT(this, bands);
  in = new AudioIn(this, 0);

  // start the Audio Input
  in.start();

  // patch the AudioIn
  fft.input(in);
}

void draw() {
  background(255);
  fft.analyze(spectrum);

  for(int i = 0; i < bands; i++){
    // The result of the FFT is normalized
    // draw the line for frequency band i scaling it up by 5 to get
    // more amplitude.
    line( i, height, i, height - spectrum[i]*height*5 );
  }
}
Hints
To implement the trace, you will likely need another array of the same size as spectrum to keep track of the previous activation of each bin. Now, the tricky thing is how we should update the values of this array in each draw() call? Think about what we want:
- The trace value should be updated to the current activation if the current activation is larger than the trace value.
- Otherwise, the trace value should decrease at a constant rate.
About Fast Fourier Transform (FFT)
Fourier transform is one the most commonly used transform for spectral analysis. Fourier transform decomposes an input signal into the sum of sine waves of different frequencies (see the figure below), and the magnitudes of these sine waves are used to compute the spectrum.
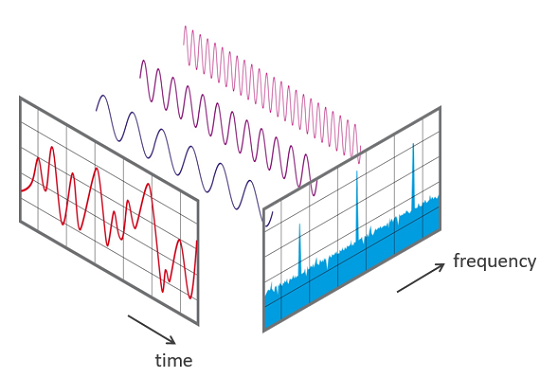
In other words, the spectrum of signal shows the distribution of the frequencies that comprise a signal. Fast Fourier transform (FT) is one efficient algorithm that is frequently used to compute the discrete Fourier transform of a signal. The YouTube video below provides a nice visual explanation of how FFT works.